One of the things that separates Hatch from other texting platforms is our focus on revenue and ROI. In fact, we consider Hatch to be not merely a communication solution, but a revenue solution powered by better and faster communication.
And the best way to show that is through reporting, which we’re excited to share has some major improvements! Read on to learn more about this exciting update.
What’s new about Hatch reporting?
Last fall, we rolled out some awesome new reporting that gave you greater visibility into the performance of your Hatch campaigns. But as you know, you’ve only been able to access it through a screen share with your Account Manager.
Now, this reporting is available right in Hatch!
You’ll still be able to meet regularly with your Account Manager, but the data will now be accessible to you at any time.
Not only is your data truly in one place now, but you also have greater access to it and can see it in new ways.
Features and benefits
There’s lots to be excited about here, and we’ll be continuously improving reporting moving forward, but here are three key features and benefits of the improved experience.
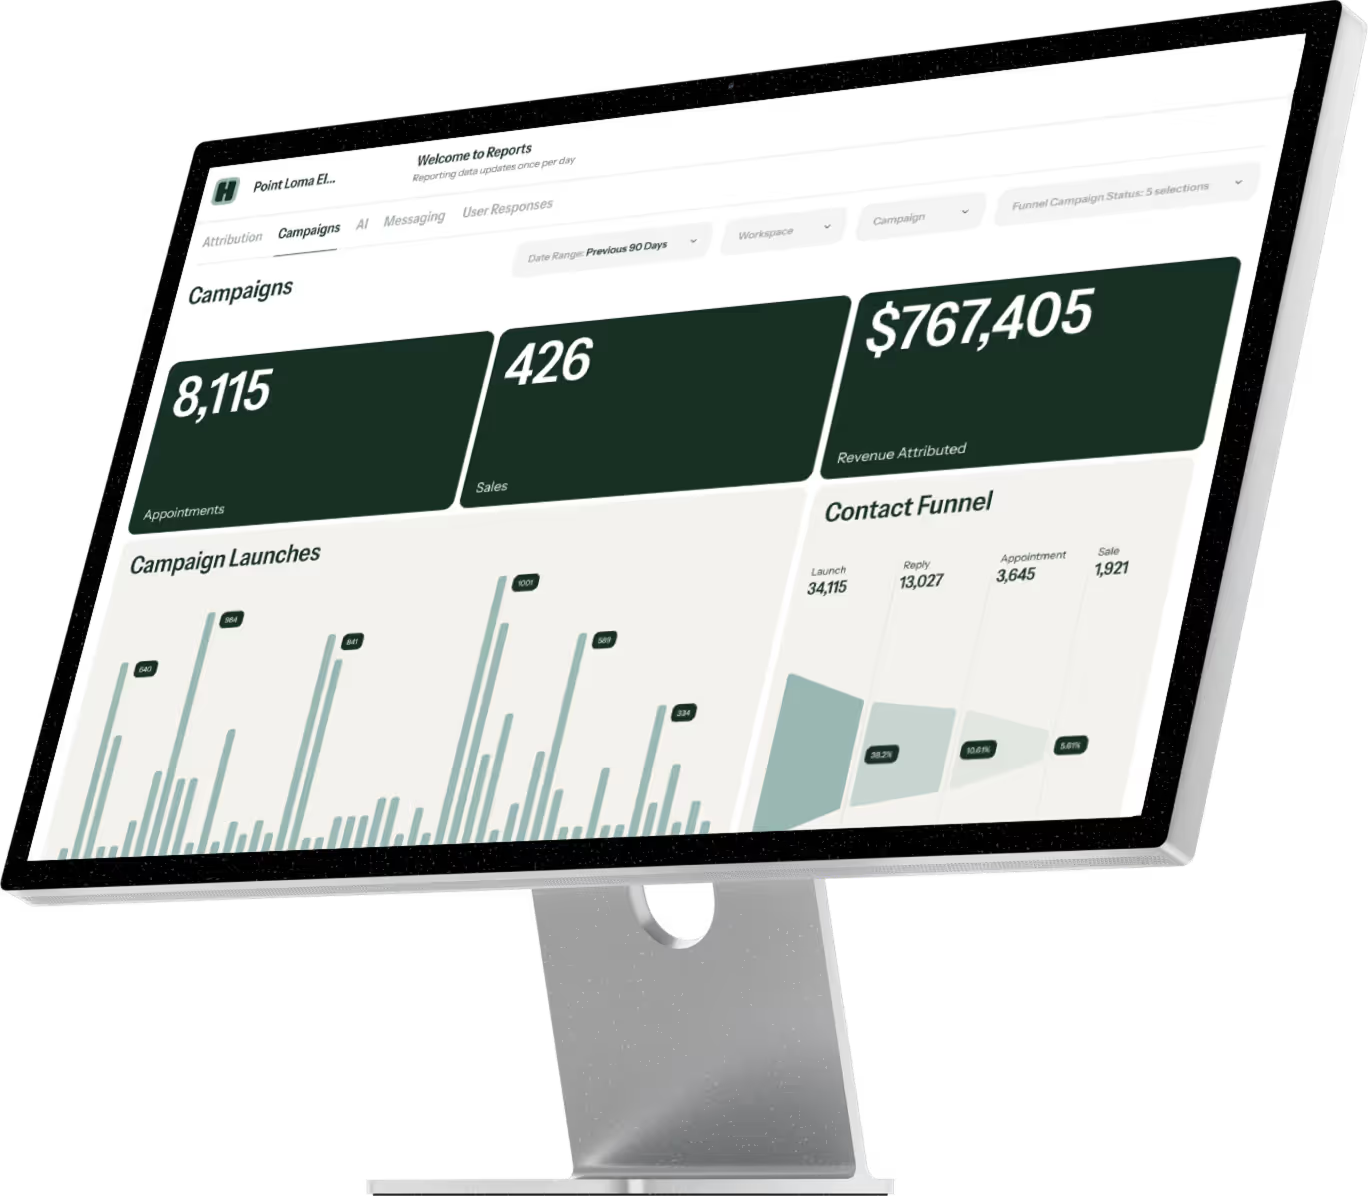
Visual data
Your data, visualized. Through charts and graphs, Hatch reporting makes your data easy to digest so you can quickly know exactly what your performance and ROI looks like.
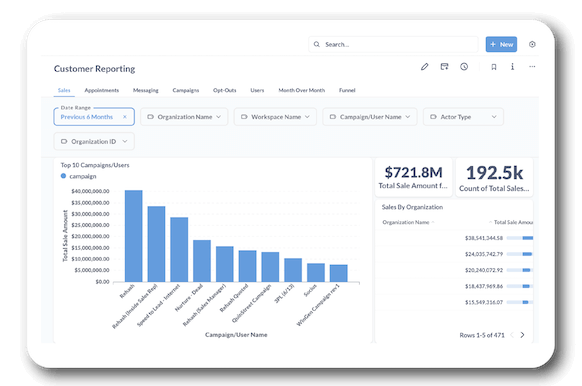
Visualize your performance and ROI metrics in a way that’s easy to understand.
Custom filtering
For any business, you have different goals and KPIs at the organizational, team, and individual level. You can now filter your Hatch reports by campaign, rep, message type, and more, enabling you to easily track and report on specific KPIs at whatever level needed.
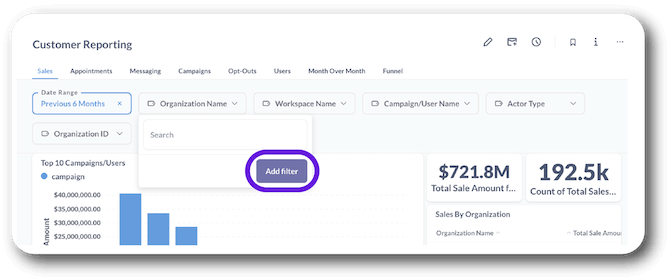
Filter your reporting to get granular data for your KPI needs.
Organized view
Everyone knows what it’s like to have papers all over the place, some with important information, and some with not-so-important information. That’s why we’re keeping your reporting organized.
Hatch reporting separates your data into tabs so you can find exactly what you’re looking for without getting overwhelmed by documents.
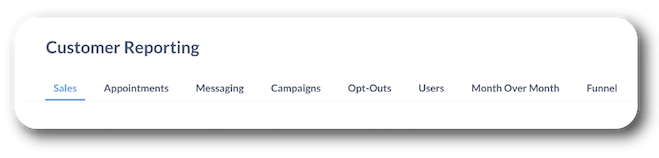
Your reporting tabs are clearly identifiable and easy to navigate, keeping your data organized and easy to view.
What data is available to me now?
As we’ve mentioned, you now have access to ALL your data from inside the app. Here’s a refresher on what each tab in your reporting includes:
- Sales: This includes both your total revenue and your Hatch-influenced revenue, so you can see what percent of sales are influenced by Hatch campaigns. You can also drill down by customer or campaign.
- Appointments: See all of your appointments driven by Hatch campaigns, broken down by campaign name.
- Messaging: See your total message count, broken down by channel (text, email, call, and voicemail).
- Opt-outs: Keep track of text opt out rates, which can be especially helpful with all of the new compliance laws.
- Campaigns: See performance metrics for each of your individual campaigns, including how many messages launched, were replied to, got canceled, are in progress, and more.
- Users: See employee performance metrics here like number of messages sent and average first response time, with the ability to view by channel, rep, campaign, workspace, or organization.
- Month over month: This tab enables you to view any of the data above (sales, appointments, messages, response rates, etc.) in a month-over-month format so you can see bigger picture trends.
- Funnel reporting: This tab gives you a visual representation of your pipeline so you can see the journey from “contacted” to “sold,” showing conversion rates at each milestone.
For a more in-depth look at these metrics, check out our Knowledge Base Page on Reporting in Hatch.
Why is my reporting not showing up?
There are two likely reasons for your reporting to not show up properly in the Hatch app. Hatch reporting works so well because the app integrates and maps to your active customer relationship management (CRM) system.
So, if your information isn’t complete within your CRM or you haven’t fully connected Hatch to your CRM, the data won’t be recorded properly.
A quick fix you may be able to do on your own, is follow these steps:
- Go to your “Sales” tab in Hatch
- Click the “Set up Conversion Reports” button
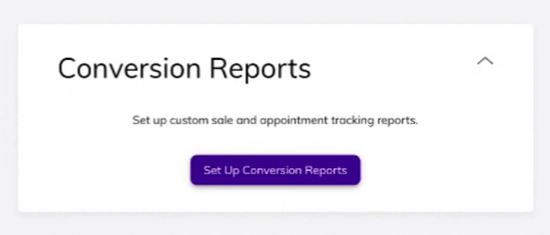
- Completely fill out and submit the form
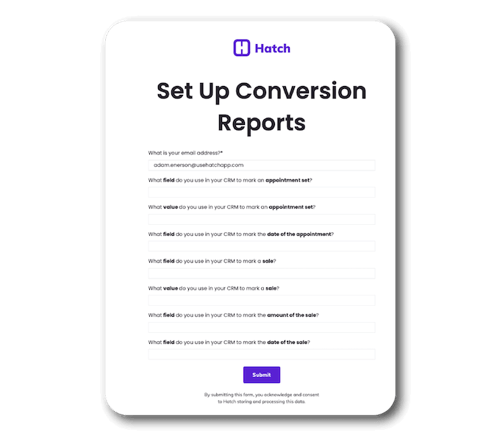
This is what the form should look like when you go to connect and map your CRM to Hatch.
Don’t be daunted though! If you’d prefer not to go in on your own, your Account Manager can walk you through the process to get your reporting squared away! Click here to have your Account Manager reach out to you.
Dive into your Hatch data today
At the end of the day, it’s not just better communication that you want—it’s happier customers, high-performing teams, and revenue growth. And you can’t achieve that without measurable outcomes! These reporting improvements are meant to equip you with just that by giving you greater accessibility to your data. Check out your easy-to-visualize data, filter for the reports you need most, and stay organized all from the Hatch app today.